This animated map shows the total number of confirmed COVID-19 cases in California state prisons from April 15, 2020 to October 15, 2020. The physical structure, underfunding, overcrowding, and pandemic mismanagement of the California state prison system left inmates at high risk of COVID-19 infection (Harris et al 2020; Okano and Blower 2020). Outbreaks at individual prisons were sometimes related: as late as June 2020, the California Department of Corrections and Rehabilitation was knowingly transferring inmates from the already heavily infected California Institution for Men in Chino to other prisons, including San Quentin (Christensen and Winton 2020). The speed and severity of the San Quentin outbreak can be seen starting 06-15-2020 on the animated map above.
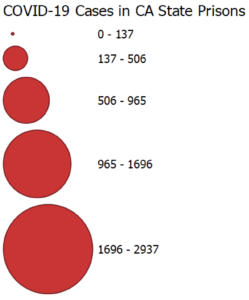
(Video: An animated map of California with red dots representing COVID-19 cases in state prisons. The dots grow dramatically in size between April and October, particularly in June through August.)