Our dataset can illuminate trends over time in reported COVID-19 cases and deaths from the past few months, beginning on March 10, 2020. Although the data included is collected and compiled from each state prison, the dataset lacks the context of each individual facility’s information and demographics such as net population or which state counties prisoners are committing, or coming, from. This context had to be supplemented by additional research and data. Even so, data that breaks down a facility’s net population by race or ethnicity are largely unavailable. Our research revealed that there is a glaring absence of such data, and when demographic data on inmates is available, it has typically been collected at the state population level.
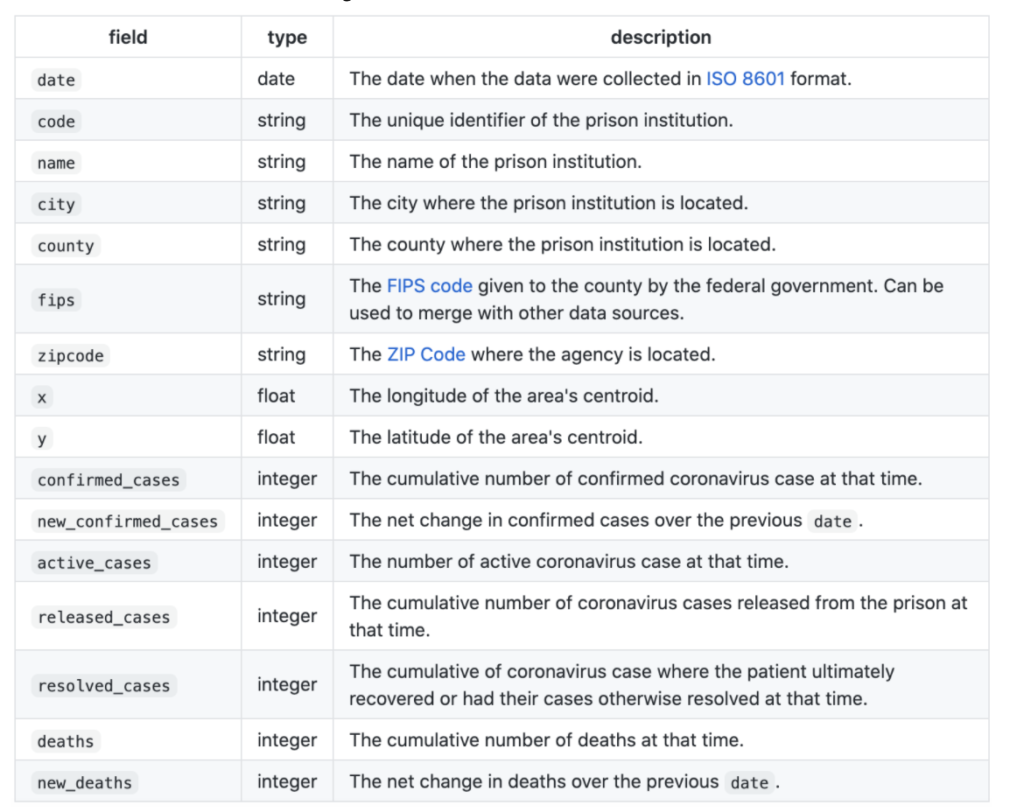
Our dataset includes the following:
Given the high granularity of the available data, we ended up having to aggregate case-counts/deaths at a particular prison for some of the thematic maps we created. In the process of doing this, we were surprised to find that with respect to time, some prisons’ cumulative case counts were not changing for months on end. For example, the number of cases at the Richard J. Donovan Correctional Facility in San Diego remained static at 3 from August 1st to December 7th, an unlikely reality given the prison houses over 3600 inmates. After doing some digging, we found a likely culprit: in the two weeks preceding December 7th the prison only tested 8% of its population, miniscule compared to a place like the California Correctional Facility which tested 85% of its inmates in the same period (Komala 2020). Considering this information, it is likely that the CDCR data used in this project underreports COVID-19 cases in a general sense, and highlights yet another struggle incarcerated persons have to reckon with.